spinner Loading...

Data Sharing: share your data online.

We help you to give visibility to your data, identify suitable formats, processing algorithms and licences and to use technologies known by application developers.
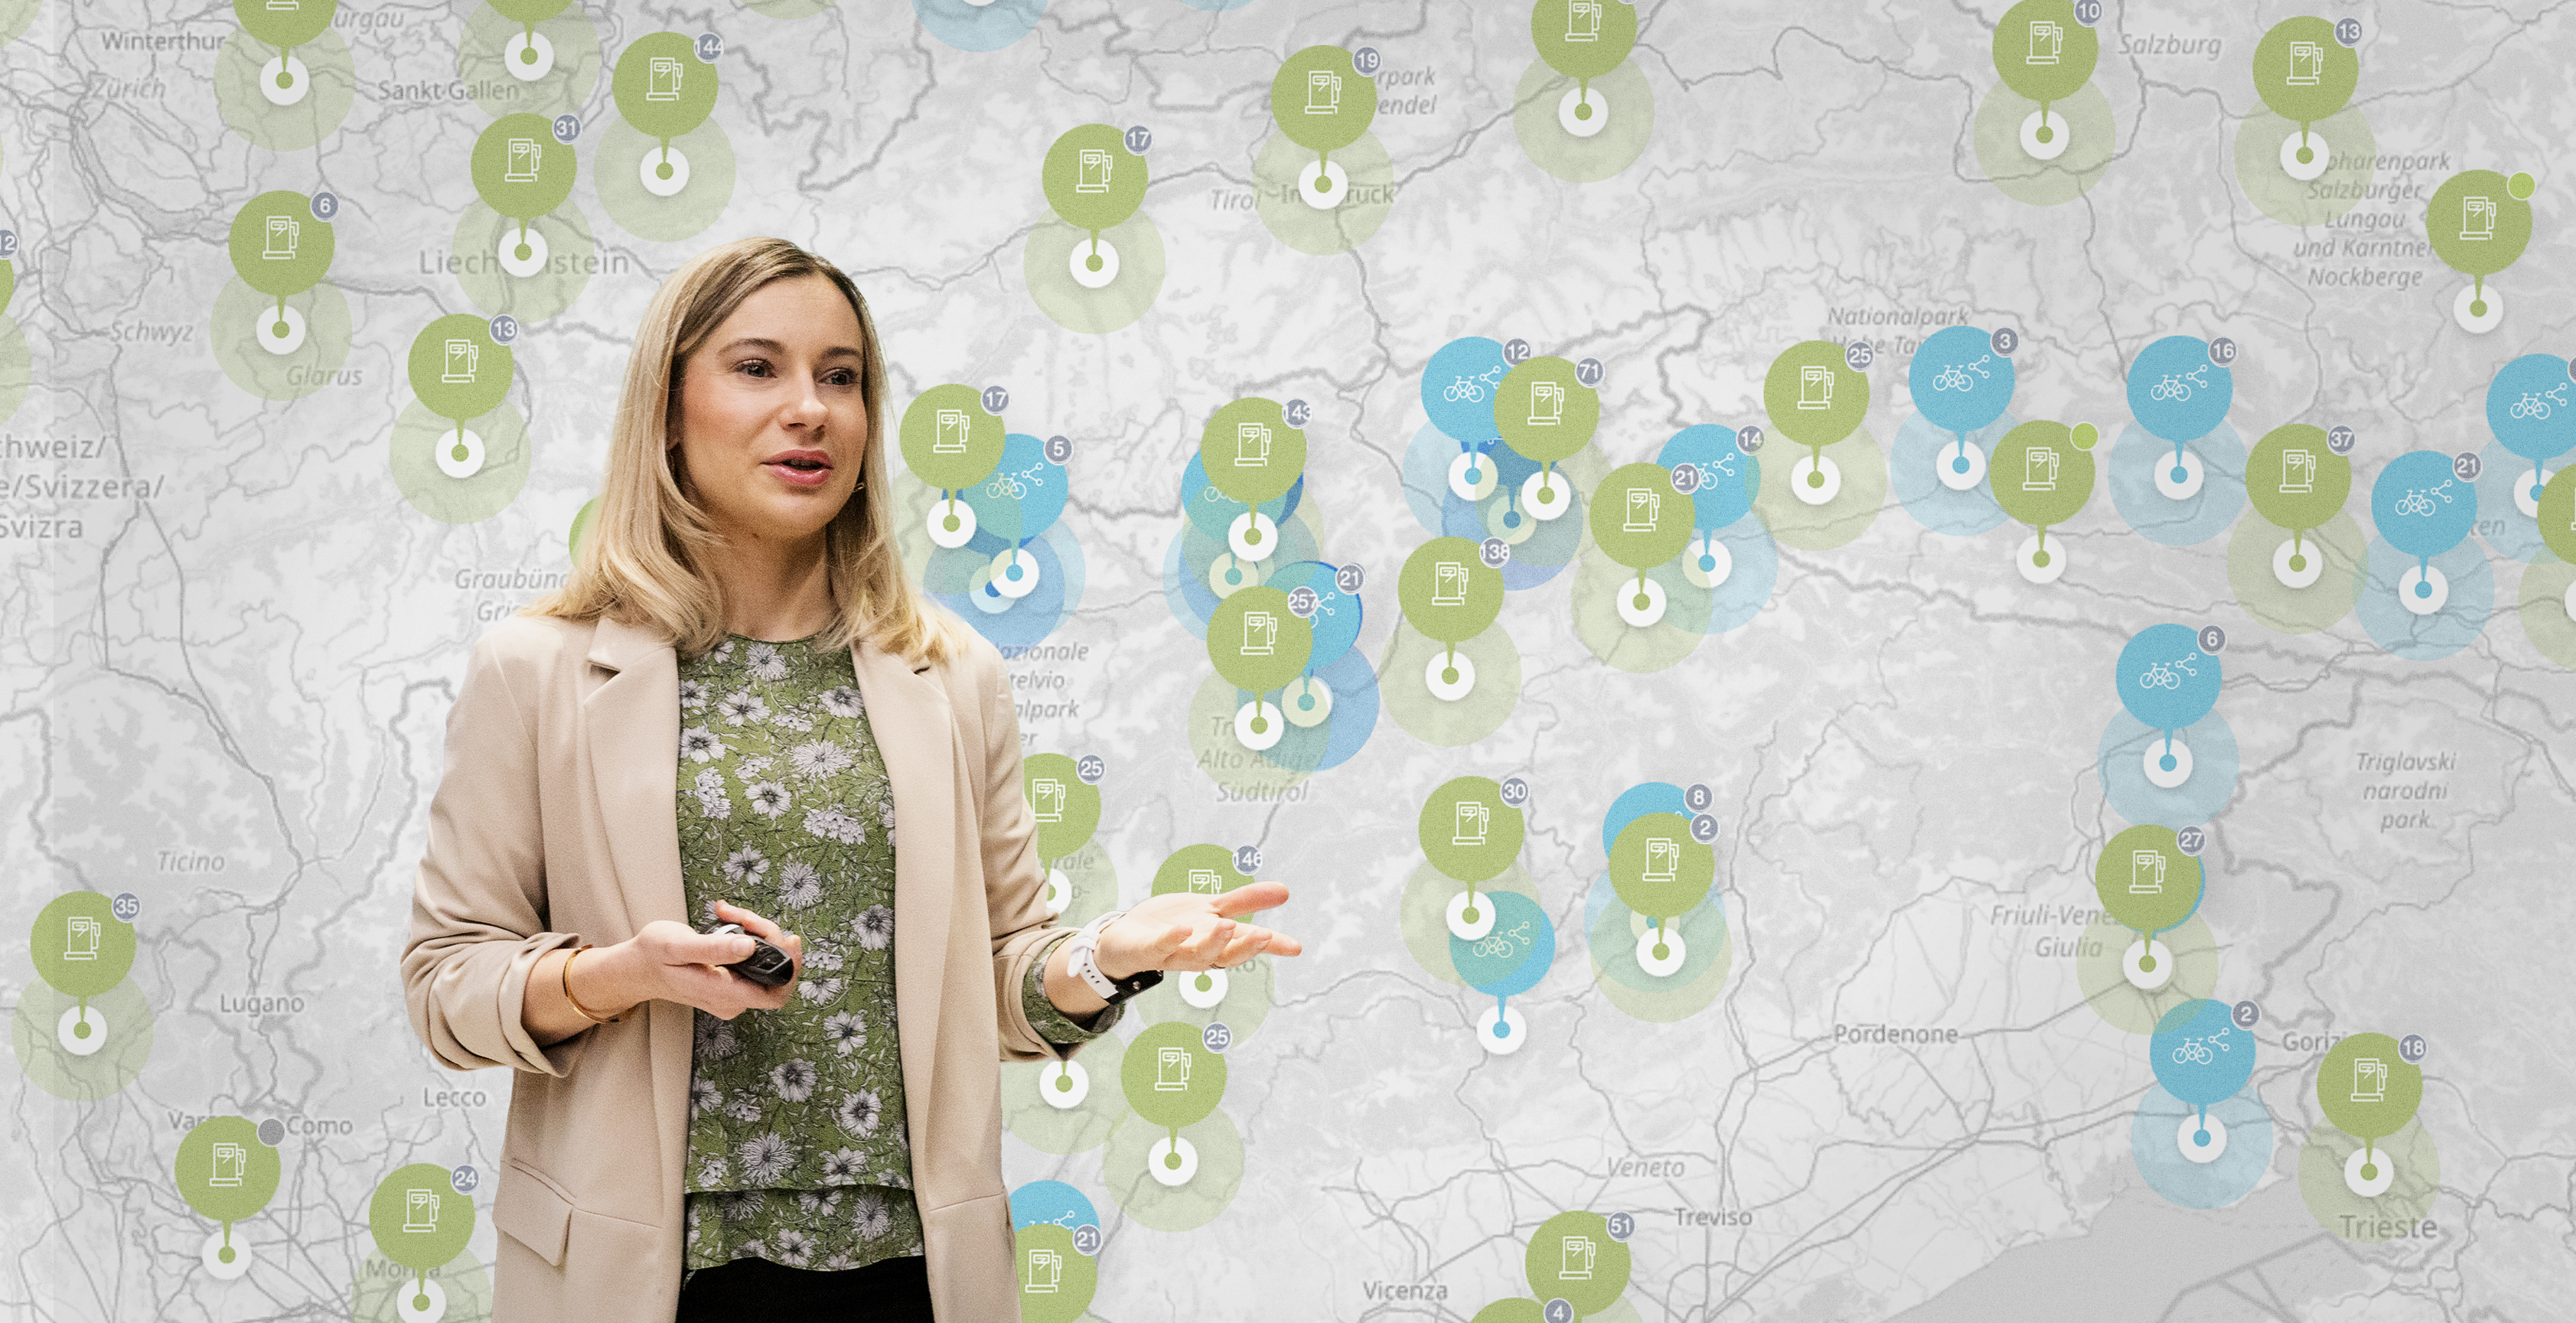
By sharing your data, you will get

  • Visibility of your data
  • Visibility as a data provider in the Open Data Hub community
  • Advanced infrastructure to publish your data in a standardised way
  • Documentation
  • Web Component store for demo apps
  • Regular communication towards data consumers
  • Statistical overview on data consumption
  • Ticket queue for handling requests and problems
  • Error monitoring and escalation

Join the community

Let your business grow by sharing your data.

Do you have data in the Tourism, Mobility, Traffic or Weather domains? Or any other data you think may be useful to the Open Data Hub Community?

Contact us now!

Let your business grow by sharing your data.
Invest now on your valuable data

Invest now on your valuable data

One-off cost for the development of a data collector that automatically queries the source API and returns the data according to the data structure of the Open Data Hub

Get started

Up and running in just two months

“The development time for a data collector depends on the complexity of the shared data. Typically, the development time is around 2 months, which we usually break down into 4 sprints:

  • Sprint 1 (weeks 1-2): basic configuration of the data collector
  • Sprint 2 (weeks 3-4): development of the adapter part with respect to the customer’s API
  • Sprint 3 (weeks 5-6): development of the adapter part of the Open Data Hub API
  • Sprint 4 (weeks 7-8): testing and production start of the application”

Start now
Up and running in just two months
Still in doubt? We help you to see data come alive!

Still in doubt? We help you to see data come alive!

Do you need to test the potential of your data? Our experts will help you to test your idea and make it concrete with the Data Visualization service.

Learn more about Data Visualization