 Loading...
 Loading...
In today’s data-driven world, data visualisation is a powerful tool that enhances comprehension and facilitates communication. Eurac uses the Open Data Hub’s visualisation tools to create customised visual outputs that boost event visibility and audience engagement.


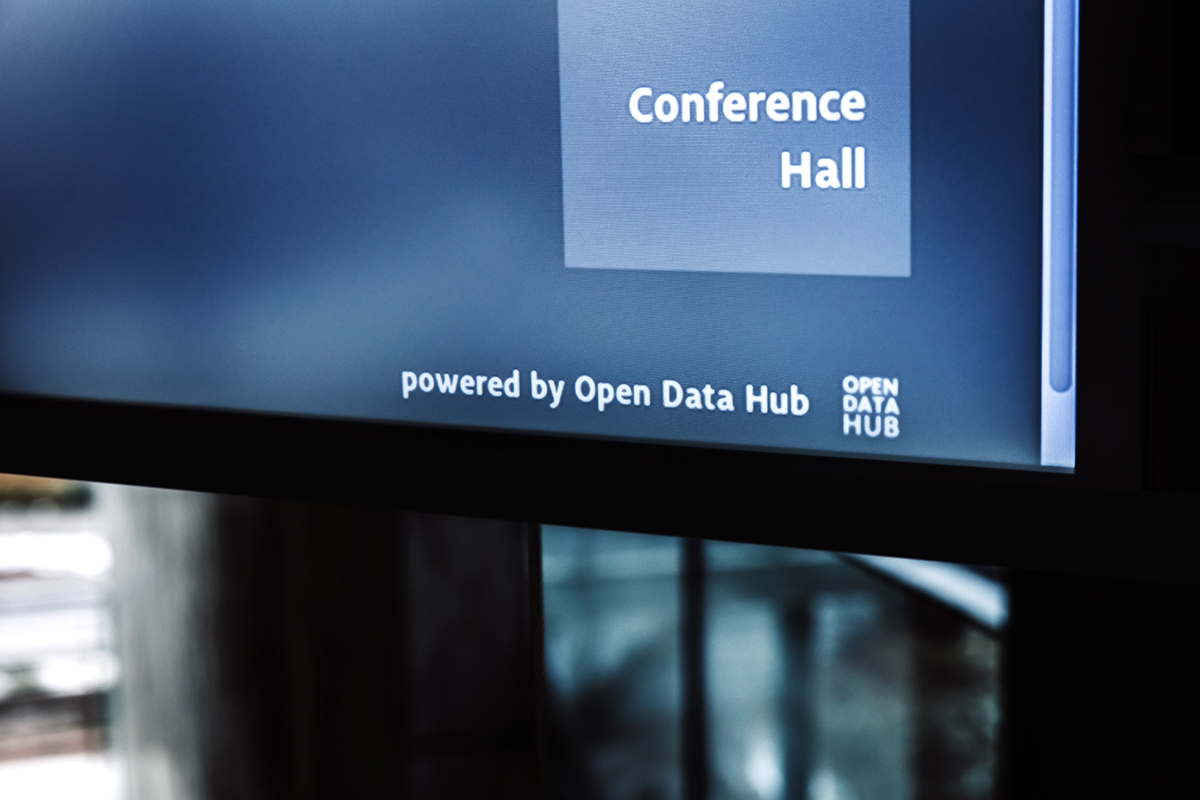
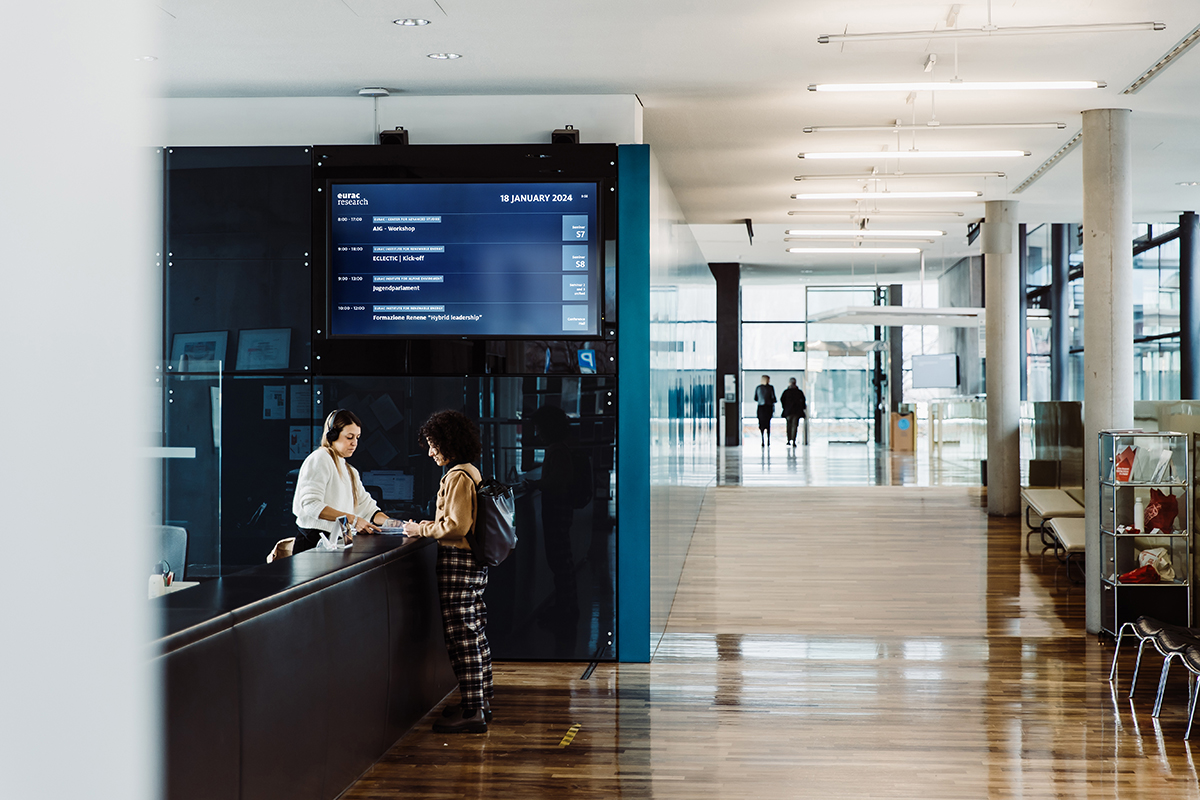
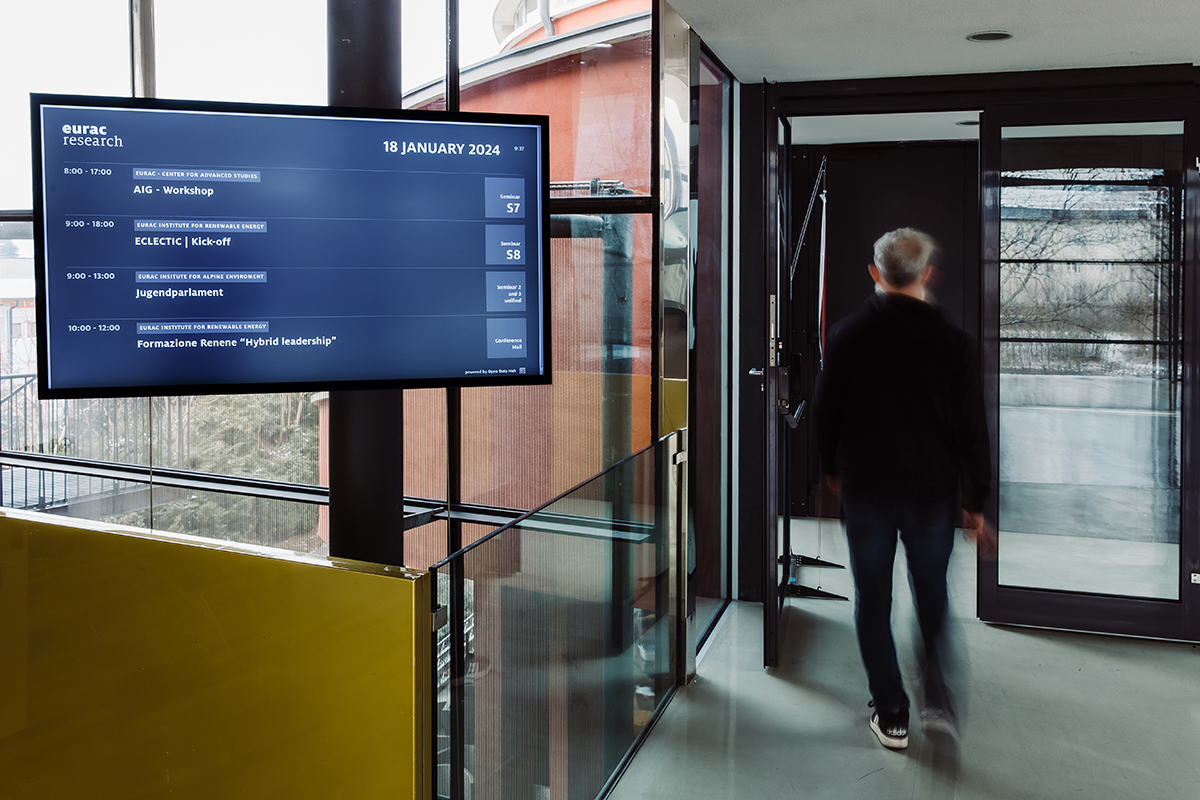
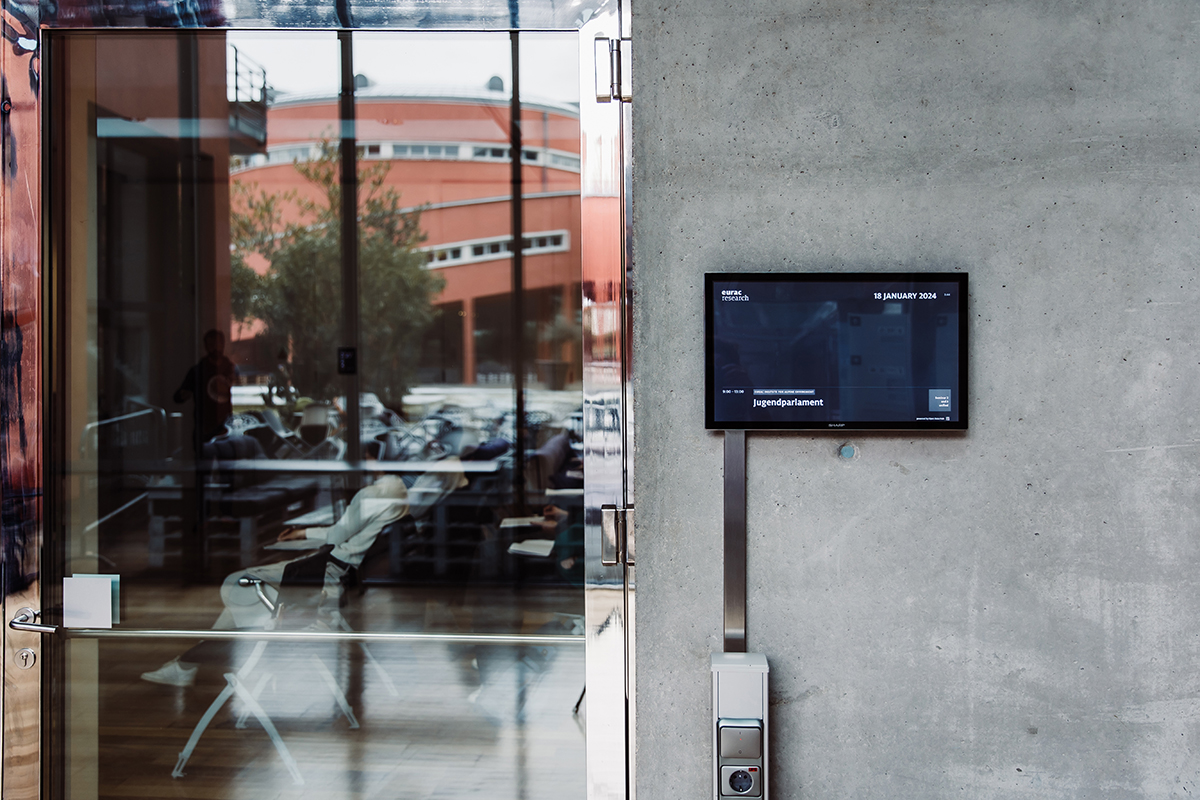
Eurac Research, a research centre headquartered in Bolzano, sought to improve the visibility and accessibility of events taking place within its facilities. To this end, they opted for a solution based on open-source data visualisation tools provided by the Open Data Hub. Integrating the Today@NOI web component significantly increased clarity by displaying real-time event information. Eurac events are now displayed on screens using a data visualisation platform for open data that has been tailored to their design and identity.
The effortless reconfiguration of a web component using standard APIs was facilitated by harnessing the capabilities of the Open Data Hub and sharing relevant datasets. This straightforward tweak to the setup enabled events to be displayed either on-site or remotely. This custom data visualisation solution for businesses saved time and resources while showcasing the flexibility of the Open Data Hub’s visualisation services in meeting specific organisational requirements efficiently.


If you need to present your events in a simple and effective way, or if you are generally interested in our data visualisation services, please do not hesitate to contact us. We provide scalable, interactive solutions that can be tailored to your requirements.
Data visualization